bootsonground
How AI Scores Near-Misses and Predicts Workplace Risk: The BootsOnGround Framework (2026)
Every near-miss is a warning your facility is sending you. BootsOnGround's AI reads that warning, scores the risk, and alerts your team before the next one becomes a Lost Time Injury.
AI near-miss scoring analyzes incident reports, photos, and worker observations to automatically calculate a Dynamic Risk Score for every zone in your facility. Using computer vision, natural language processing, and pattern recognition, the system ranks hazard severity, tracks rising risk trends, and issues predictive alerts before an incident occurs. The result is a shift from reactive incident reporting to proactive risk prevention.
Why Near-Misses Are Your Most Valuable
Safety Data Point
In traditional safety management, a near-miss gets logged in a monthly report and forgotten. In 2026, it is the most important data point your facility generates.
Every near-miss is a signal. A failure pathway exists. The conditions that could produce a serious injury are already present. The only thing that prevented an outcome was timing or chance.
Workplace injuries cost U.S. businesses over $1 billion every week, and many organizations still rely on manual processes that leave them exposed to both incidents and regulatory penalties (Source: Liberty Mutual Workplace Safety Index, 2025). The organizations closing that gap are the ones treating near-miss data as a predictive asset rather than a compliance checkbox.
AI predictive analytics can monitor operational data to detect converging risk conditions and flag potential hazards before they escalate, an approach that traditional manual safety processes consistently fail to deliver (Source: OSHA.gov, 2025).
BootsOnGround's AI framework is built on this principle. Here is exactly how it works.

The AI-Enhanced Risk Priority Number
Most safety professionals know the Risk Priority Number, or RPN, from Failure Mode and Effects Analysis. The traditional formula is:
RPN = Severity x Occurrence x Detection
The problem with a manual system is that all three variables are estimated by a human who may be under time pressure or unconsciously biased toward a lower score to avoid triggering an escalation. BootsOnGround's AI removes human estimation from the equation entirely.
Severity is assessed by computer vision and natural language processing analyzing the photo and description submitted with each near-miss report. The AI identifies Critical Entities present in the report, such as heavy machinery, confined spaces, high-voltage equipment, or working at height, and assigns a severity weight based on historical industry outcomes for those specific conditions.
Occurrence is calculated by scanning the historical record for the specific zone or task type where the near-miss occurred. If similar reports are rising in frequency, the occurrence variable increases exponentially rather than linearly. A zone with three similar near-misses in 30 days receives a significantly higher score than a zone with one report because the trend itself is the risk signal.
Detection measures the probability that a failure in that zone would go undetected without the platform. If a zone is currently showing Red status on the Traffic Light Protocol, meaning inspections are overdue, the detection score increases sharply. An undetected failure in an uninspected zone is categorically more dangerous than the same failure in a zone inspected an hour ago.
The output is an objective, data-driven RPN that reflects what is actually happening on your floor, not what a safety officer estimated on a Friday afternoon.
Clustering Algorithms and the Pre-Fatality Signal
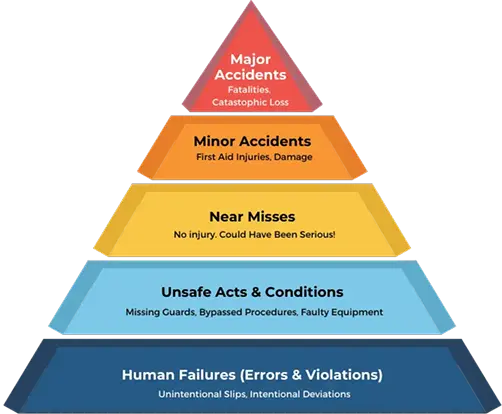
Heinrich's Triangle has guided safety management for nearly a century. Its core principle is that reducing near-misses at the base of the triangle prevents fatalities at the top. The limitation in a manual system is that it only counts near-misses. It cannot tell you which clusters are building toward a serious outcome.
BootsOnGround applies clustering algorithms to near-miss data to move beyond counting and into pattern recognition. If a cluster of reports categorized as slips and trips in the loading dock grows by 15% in a single week, the AI flags it as a Pre-Fatality Cluster and triggers a mandatory safety review for that zone.
A 2025 study found that AI algorithms analyzing incident descriptions achieved an 87% compliance rate with expert safety assessments, confirming that machine analysis of near-miss reports can match the judgment of experienced safety professionals at a fraction of the time and cost (Source: Nowobilski et al., 2025).
The Culture Multiplier: Sentiment as a Risk Variable
One of the most significant innovations in BootsOnGround's framework is the treatment of safety culture as a quantifiable risk variable rather than a qualitative observation.
The platform's Sentiment Propagation Monitoring analyzes unstructured text from the Community Wall, near-miss descriptions, and open-field inspection comments. When the AI detects a statistically significant rise in language associated with fatigue, confusion, or feeling rushed, it adds a Culture Multiplier to the facility's overall risk score.
The formula becomes:
Final Risk Score = (Severity x Occurrence x Detection) x Culture Multiplier
When the Culture Multiplier rises above 1.2, it indicates that the human element of safety is degrading. Worker fatigue and low morale are documented preconditions for serious incidents across industries. A Culture Multiplier above 1.2 is one of the most reliable leading indicators that a facility is approaching elevated risk, often days before any physical hazard is formally reported.
This variable only works if workers are actively submitting observations and feedback. The Community Wall is not just an engagement feature. It is a data collection mechanism that feeds directly into the risk engine.
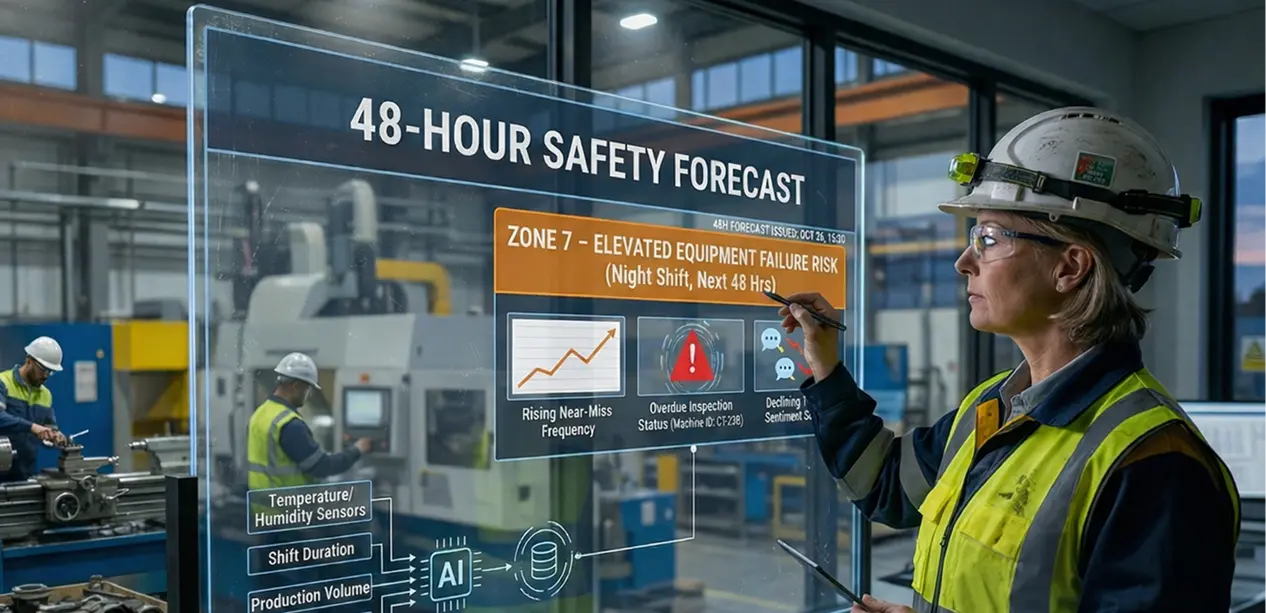
The 48-Hour Safety Forecast
By combining the AI-enhanced RPN, cluster analysis, and sentiment monitoring with environmental data including temperature, humidity, shift duration, and production volume, BootsOnGround's predictive models identify high-risk scenarios with documented accuracy of up to 76%.
The practical output is the 48-Hour Safety Forecast. A forecast might surface a specific alert: elevated probability of an equipment failure incident on the night shift in Zone 7 over the next two days, based on rising near-miss frequency, overdue inspection status, and declining sentiment scores from that team.
The safety manager responds with targeted supervision, a shift briefing, or a maintenance check before the conditions converge into an outcome.
Businesses using AI-powered predictive safety analytics have reported incident reductions of 25% or more, with the most significant gains coming from organizations that moved beyond incident tracking into active operational risk forecasting (Source: Liberty Mutual Workplace Safety Index, 2025).
This is why BootsOnGround customers report a 40% reduction in Lost Time Injuries within their first year. The improvement is not explained by any single feature. It is the result of a system that continuously identifies where risk is highest and directs human attention to exactly those locations before an incident occurs. (Source: BootsOnGround customer data)
Frequently Asked Questions
See the AI Risk Engine in Action
BootsOnGround is certified to ISO 27001, ISO 9001, and ISO 20000, meaning every risk score, sentiment flag, and predictive alert your facility generates is processed and stored to internationally audited standards of security, quality, and service delivery. If your safety program is still treating near-misses as monthly report footnotes, you are looking at your most valuable risk data and seeing a compliance task instead of a prevention opportunity.
Read Full artile :- How to Set Up QR Safety Inspections at Your Facility
Read Full artile :- Return to the full Digital EHS Software and Workplace Safety Management Guide